


Share


 Copied
11 Metrics That Link Engagement to Revenue
26 July, 2025

Carlos Dusan
Table of Content
- 1. Conversion Rate (CR)
- 2. Average Order Value (AOV)
- 3. Customer Lifetime Value (CLTV)
- 4. Net Promoter Score (NPS)
- 5. Customer Satisfaction Score (CSAT)
- 6. Customer Effort Score (CES)
- 7. Time-to-Value (TTV)
- 8. Daily/Monthly Active Users (DAU/MAU Stickiness)
- 9. Feature Adoption Rate
- 10. Churn Rate
- 11. Net Revenue Retention (NRR)
- Engagement Dashboard: Making the Metrics Talk
- Common Mistakes (and How to Fix Them)
- 30-60-90-Day Roadmap
- FAQs
- Conclusion: Engagement Is the New Currency
Subscribe to Our Newsletter
Get the latest web development tips, SEO strategies, and industry insights delivered to your inbox.You are now subscribed to our newsletter. Thank you
Trade “likes” for dollar signs. Track the signals that prove engagement pays and watch your revenue curve go up and to the right.
1. Conversion Rate (CR)
Why it matters
The surest way to link engagement to revenue is to count how many visitors become paying customers. A 1-point conversion rate lift on a site with 50,000 monthly visits and an average order value equals $90,000 in extra sales.
Formula
CR = (total conversions ÷ total sessions) × 100
Quick wins
- Cut form fields to the essentials
- Surface social proof near CTAs
- A/B-test copy that speaks to your user’s “job-to-be-done”
2. Average Order Value (AOV)
Why it matters
The second lever in the revenue equation is average basket size. Engaged users buy more and higher-tier SKUs.
Formula
AOV = total revenue ÷ total orders
Fast fixes
- Bundle accessories or add-on services
- Offer “buy more, save more” thresholds
- Show dynamic upsells at checkout
3. Customer Lifetime Value (CLTV)
Why it matters
Repeatedly engaged customers generate durable Monthly Recurring Revenue (MRR). CLTV tells you if engagement scales profitably.
Formula (simple)
CLTV = (AOV × purchase frequency) × average customer lifespan
Ways to increase engagement
- Intelligent cross-sell email sequences
- Loyalty perks that encourage repeat visits
- Product-led onboarding that highlights stickiest features
4. Net Promoter Score (NPS)
Why it matters
Promoters not only stay—they recruit. Deloitte found enterprise accounts with high engagement drive significantly more pipeline opportunities.
How to act
- Trigger in-app surveys at key milestones
- Close the loop with detractors inside 24 h
- Convert promoters into referral champions
5. Customer Satisfaction Score (CSAT)
Why it matters
CSAT is a real-time barometer. Drops often precede churn by weeks, making it one of the clearest churn predictors based on usage.
Best practice
Collect CSAT after support tickets, onboarding calls, or major releases. Anything below 80 % demands root-cause analysis.
6. Customer Effort Score (CES)
Why it matters
The less effort a task requires, the more likely a user repeats it. Gartner reports low-effort experiences reduce churn by 37 %.
Zero-friction tactics
- Streamline sign-up with SSO
- Place contextual tooltips beside advanced settings
- Offer in-app search for docs and videos
7. Time-to-Value (TTV)
Why it matters
Long TTV kills activation and, by extension, MRR. Shorter TTVs correlate with higher engagement metrics that drive MRR.
Measure
Log the moment a user signs up → log the first “Aha!” event (e.g., first dashboard, uploaded file). Track median TTV by segment.
Shrink it
- Interactive walkthroughs
- Pre-loaded templates
- Concierge onboarding for high-ACV cohorts
8. Daily/Monthly Active Users (DAU/MAU Stickiness)
Why it matters
Stickiness (DAU ÷ MAU) shows habitual use. Social apps target > 50 %; B2B SaaS healthy is 20–30 %.
Boost stickiness
- Timely usage nudges (but never spam)
- Feature reminders driven by last-touch data
- Value-adding push notifications
9. Feature Adoption Rate
Why it matters
Only 6 % of features drive 80 % of clicks according to Pendo’s benchmark. Measuring adoption tells you where to invest or trim.
Formula
Users who used feature ÷ total active users × 100
Actionables
- Highlight under-used revenue features in-app
- Retire “ghost” features that clutter UX
- Celebrate mastery with progress badges
10. Churn Rate
Why it matters
Every lost customer erases revenue gains. Pair churn with engagement cohorts to expose churn predictors based on usage—e.g., logins < 2/week for 14 days.
Formula (customer churn)
Lost customers ÷ starting customers × 100
Prevention plays
- Auto-trigger success calls when usage dips
- Offer pause plans before full cancellation
- Add “Save the Sale” workflows with personalized offers
11. Net Revenue Retention (NRR)
Why it matters
NRR (also called Net Dollar Retention) combines expansions, downgrades, and churn—your single best revenue metric for SaaS health.
Formula
(Opening MRR + Expansion – Contraction – Churn) ÷ opening MRR × 100
Targets
• Good: > 100 %
• Great: 110–130 % (top quartile)
Move the needle
- Usage-based pricing tiers
- In-product upgrade prompts tied to seat limits
- Success stories that upsell advanced modules
Engagement Dashboard: Making the Metrics Talk
| Metric | Engagement Signal | Direct Revenue Lever |
| Conversion Rate | First activation | New sales |
| TTV | Onboarding speed | Faster MRR realization |
| Session Duration | Depth of use | Higher AOV, ad yield |
| Feature Adoption | Breadth of use | Expansion revenue |
| NRR | All of the above | Compounding growth |
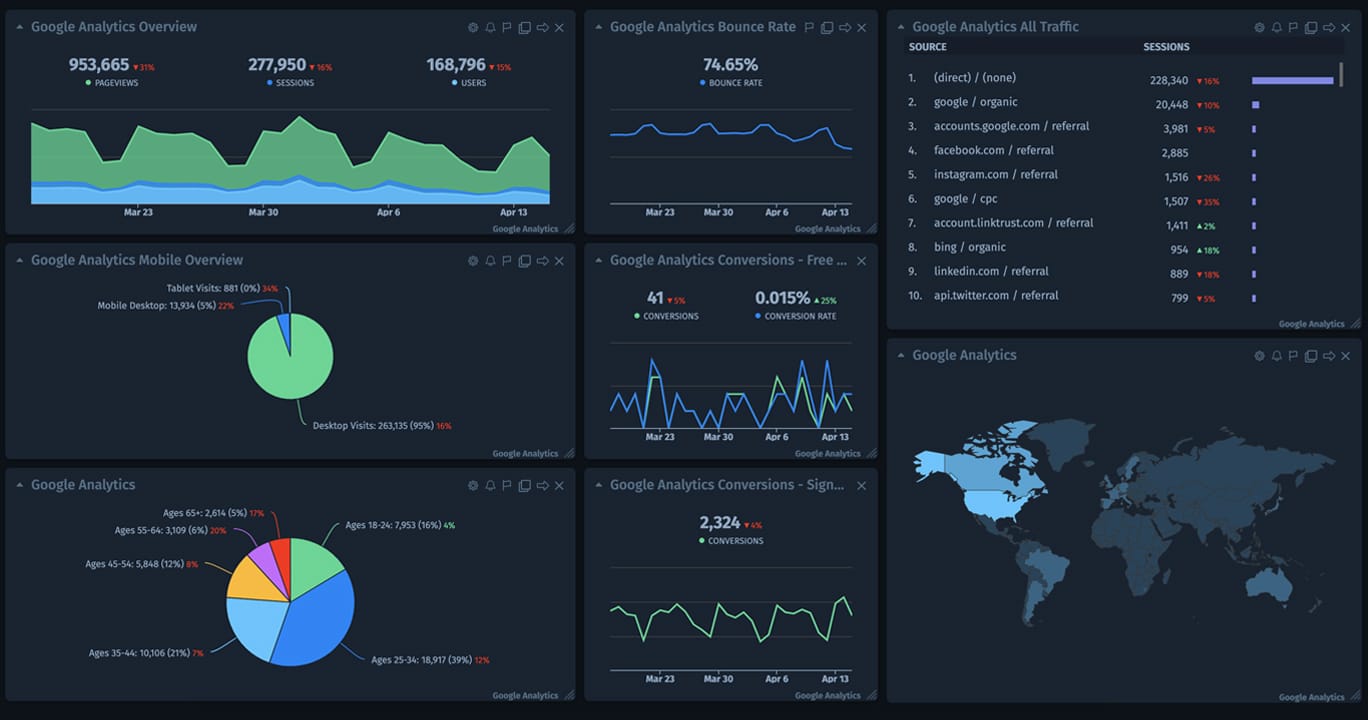
Include an “Engagement ➜ Revenue” dashboard in GA4, Mixpanel, or Amplitude. Pipe session duration and revenue per engagement score (RPEM) from ad stacks like Playwire to prove content ROI.
Common Mistakes (and How to Fix Them)
Vanity metrics obsession
Fix: Pair every engagement metric with a revenue twin.
Annual targets for monthly KPIs
Fix: Review metrics at least monthly; daily for CR/TTV.
Tool silos
Fix: Centralize in a BI layer; enforce one source of truth.
Ignoring lag vs. lead indicators
Fix: Monitor lead metrics (CES, TTV) to prevent lag disasters (churn).
30-60-90-Day Roadmap
Day 30 – Audit data sources, define formulas, set baselines
Day 60 – Build live engagement-to-revenue dashboard, train teams
Day 90 – Tie metrics to OKRs, launch two revenue experiments (e.g., TTV sprint, adoption nudges)
FAQs
Which metric matters most for an early-stage startup?
Focus on TTV and Conversion Rate—you need users activated and paying fast.
How often should benchmarks refresh?
Quarterly at minimum; monthly in hyper-growth phases.
What if my sample size is tiny?
Rely on directional trends and qualitative interviews until you hit ≥ 100 data points.
Conclusion: Engagement Is the New Currency
Stop guessing. Treat these 11 metrics as a revenue GPS. When Conversion, TTV, and Adoption move, you’ll link engagement to revenue—and the board will notice.